
P041 Characterization of cytokine and drug concentrations in serum, mucosa and faeces during induction treatment of moderate-to-severe ulcerative colitis with anti-TNF monoclonal antibodies
Van Oostrom, J.(1);Hanzel, J.(1,2);Verstockt, B.(3,4);Singh, S.(5);Smith, J.(5);Stylli, J.(5);Vermeire, S.(3);D'Haens, G.(1);
(1)Amsterdam UMC- Meibergdreef 9- 1105 AZ Amsterdam- The Netherlands, Gastroenterology, Amsterdam, The Netherlands;(2)UMC Ljubljana- Japljeva ul. 2- 1000 Ljubljana- Slovenia, Gastroenterology, Lubljana, Slovenia;(3)University Hospitals Leuven- KU Leuven- Leuven- Belgium, Department of Gastroenterology and Hepatology, Leuven, Belgium;(4)KU Leuven- Leuven- Belgium, Department of Chronic Diseases and Metabolism-, Leuven, Belgium;(5)Progenity Inc, Progenity laboratories, San Diego, United States;
Background
It remains unclear why up to 30% of patients with moderate-to-severe ulcerative colitis (UC) do not respond to anti-TNF treatment (anti-TNF). In this study, we explored multi compartment cytokine and anti-TNF concentrations in peripheral blood (PB), faeces (F) and colonic mucosa (CM) before, during and after anti-TNF induction treatment in UC.
Methods
91 UC patients starting infliximab or adalimumab were included at two tertiary centres (table 1). Patients underwent clinical and endoscopic assessment with CM, PB, and F sampling at baseline. Follow-up CM samples were taken at first follow-up endoscopy during the first year. Follow-up PB and F samples were taken at follow-up endoscopy and optionally on day 3, 7, 14, and 28.
Response (R) was defined as Mayo endoscopic score (MES) 0-1 (assessed by a blinded independent reader) and subsequent anti-TNF therapy for > 1 year. All other patients were classified as non-responders (NR).
TNFα, IL6, IL10 and drug levels were measured in all compartments and OSM and IL12p40 in PB and CM (F anti-TNF with ELISA and cytokines and PB and CM anti-TNF with a bead-based immunoassay). CM samples were normalised for gram of protein (gop).
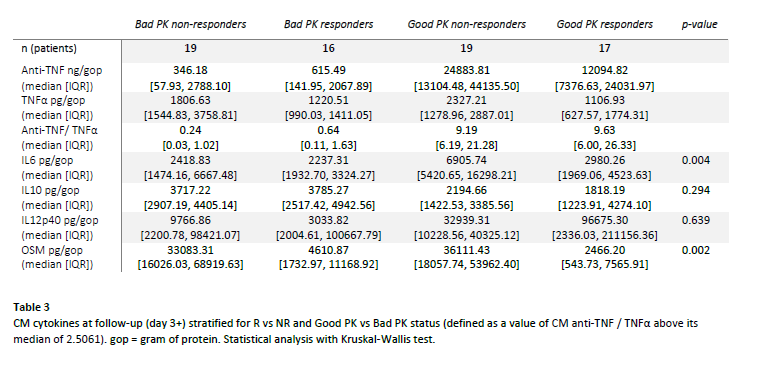
To differentiate pharmacokinetic (PK) from pharmacodynamic (PD) failures, we calculated CM anti-TNF/ TNFα. We classified values above the median as sufficient PK (Good PK) and values below as insufficient PK (Bad PK).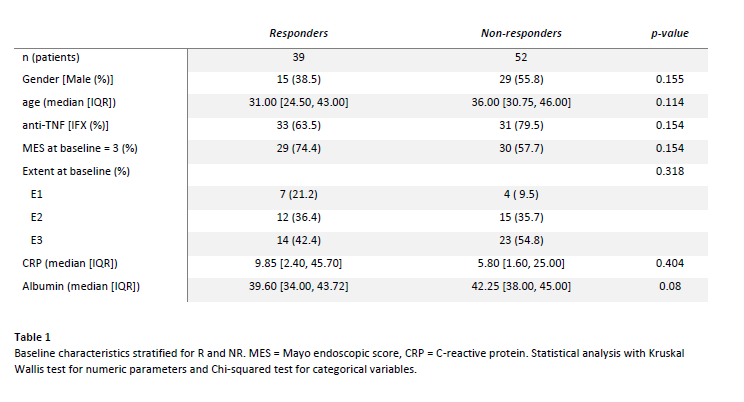
Results
We analysed CM, PB and F samples from 71, 91 and 32 patients respectively. Baseline cytokine concentrations were similar in all compartments.
At follow-up (table 2), PB IL6 was lower in R (p=0.045). All F cytokines were significantly higher in R (TNFα: p<0.001; IL6: p<0.001; IL10: p<0.001). In CM, IL6 and OSM were lower and IL12p40 higher in R (IL6: p=0.004; OSM: p=0.01; IL12p40: p=0.021).
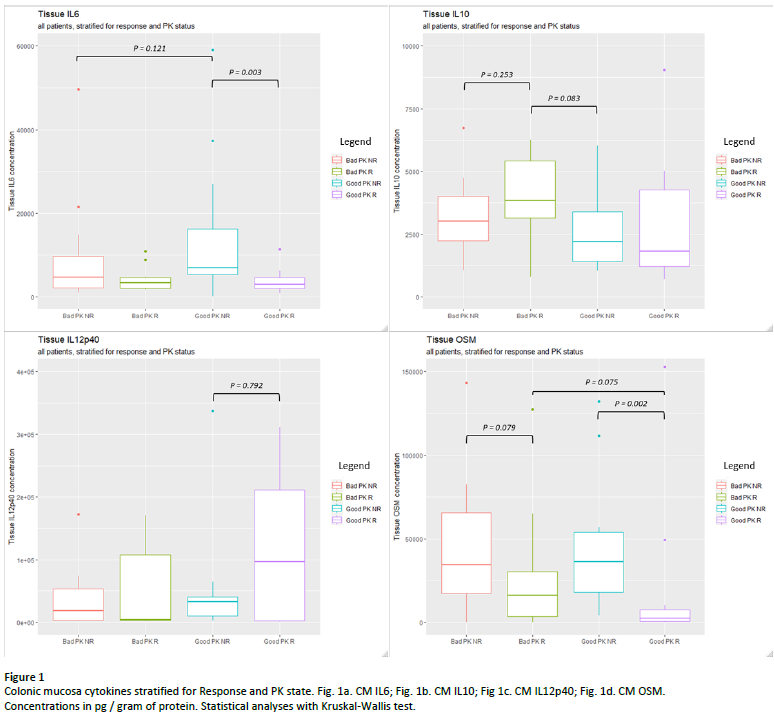
After stratification of CM samples for PK readouts (table 3, figure 1), IL6 was highest in Good PK NR vs Good PK R (6905 vs 2980 ng/gop, p = 0.002) and OSM was lowest in R vs NR groups (2466 vs 36111 ng/gop in Good PK R vs Good PK NR, p = 0.002). Trends were observed towards highest IL10 in Bad PK R and Highest IL12p40 in Good PK R, although not significant.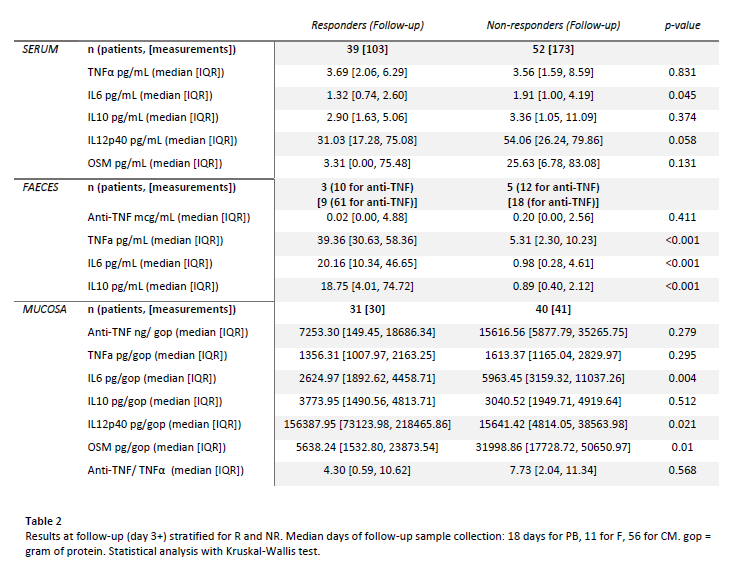
Conclusion
Baseline cytokine concentrations in PB, CM and F did not predict response to anti-TNF induction treatment in UC. At follow-up, response (R) was characterised by lower PB IL6; higher F cytokines; lower CM IL6 and OSM and higher IL12p40.
After stratification for PK, pharmacodynamic failure (Good PK NR) was characterised by highest CM IL6, indicating it is a driver to inflammation alternative to anti-TNF. R was characterised by lowest OSM regardless of PK, indicating OSM mainly reflects disease activity. Further research focuses on cytokine-PK interplay contributing to anti-TNF (non-) response.