
P062 31P MRS and MRI phenotyping of muscle metabolic quality in IBD fatigue
Mcging, J.(1,2);Nicholas, R.(2);Serres, S.(3);Greenhaff, P.(3,4,5);Francis, S.(2);Moran, G.W.(1,5);
(1)University of Nottingham, School of Medicine, Nottingham, United Kingdom;(2)University of Nottingham, Sir Peter Mansfield Imaging Centre, Nottingham, United Kingdom;(3)University of Nottingham, School of Life Sciences, Nottingham, United Kingdom;(4)University of Nottingham, MRC Versus Arthritis Centre for Musculoskeletal Ageing Research, Nottingham, United Kingdom;(5)National Institute for Health Research, Nottingham Biomedical Research Centre, Nottingham, United Kingdom;
Background
Fatigue perception and exercise intolerance are common in inflammatory bowel disease (IBD). The mechanisms are unknown, although physical deconditioning is greater in fatigued relative to non-fatigued patients, suggesting an aetiological role for deconditioning. To assess peripheral muscle quality in Crohn’s disease (CD), we quantified the time-course of muscle phosphocreatine (PCr) recovery, which is wholly mitochondrial dependent, following ischaemic high-intensity exercise in fatigued CD and HV.
Methods
Participant body mass and regional body composition was assessed by DEXA. All MR data was collected using a 3T Philips Achieva scanner and a 14cm 31P coil on the medial gastrocnemius muscle. 1H mDIXON scans were acquired to image the calf prior to ischaemic plantar flexion exercise at 50% maximum voluntary contraction (MVC) using an MR-compatible ergometer (Trispect, Ergospect) during non-localized pulse-acquire 31P-MRS. 31P spectra were analysed using jMRUI Beta 6.0 using the AMARES function with prior knowledge. Cytosolic pH was estimated using the chemical shift difference between Pi and PCr peaks. Post exercise PCr recovery was quantified after reinstating limb blood flow. PCr recovery was expressed relative to baseline (non-ischaemic) signal amplitude and fit to a mono-exponential function in GraphPad prism. (PCr(t) = PCrinitial+(PCrend – PCrinitial)(1-exp(-k.t)) where t is the time from the start of non-ischaemic recovery, PCrinitial and PCrend is the PCr signal at the initial and end of recovery phases. An FSL and Matlab pipeline was used to obtain calf muscle volume and fat fraction from 1H mDIXON images.
Results
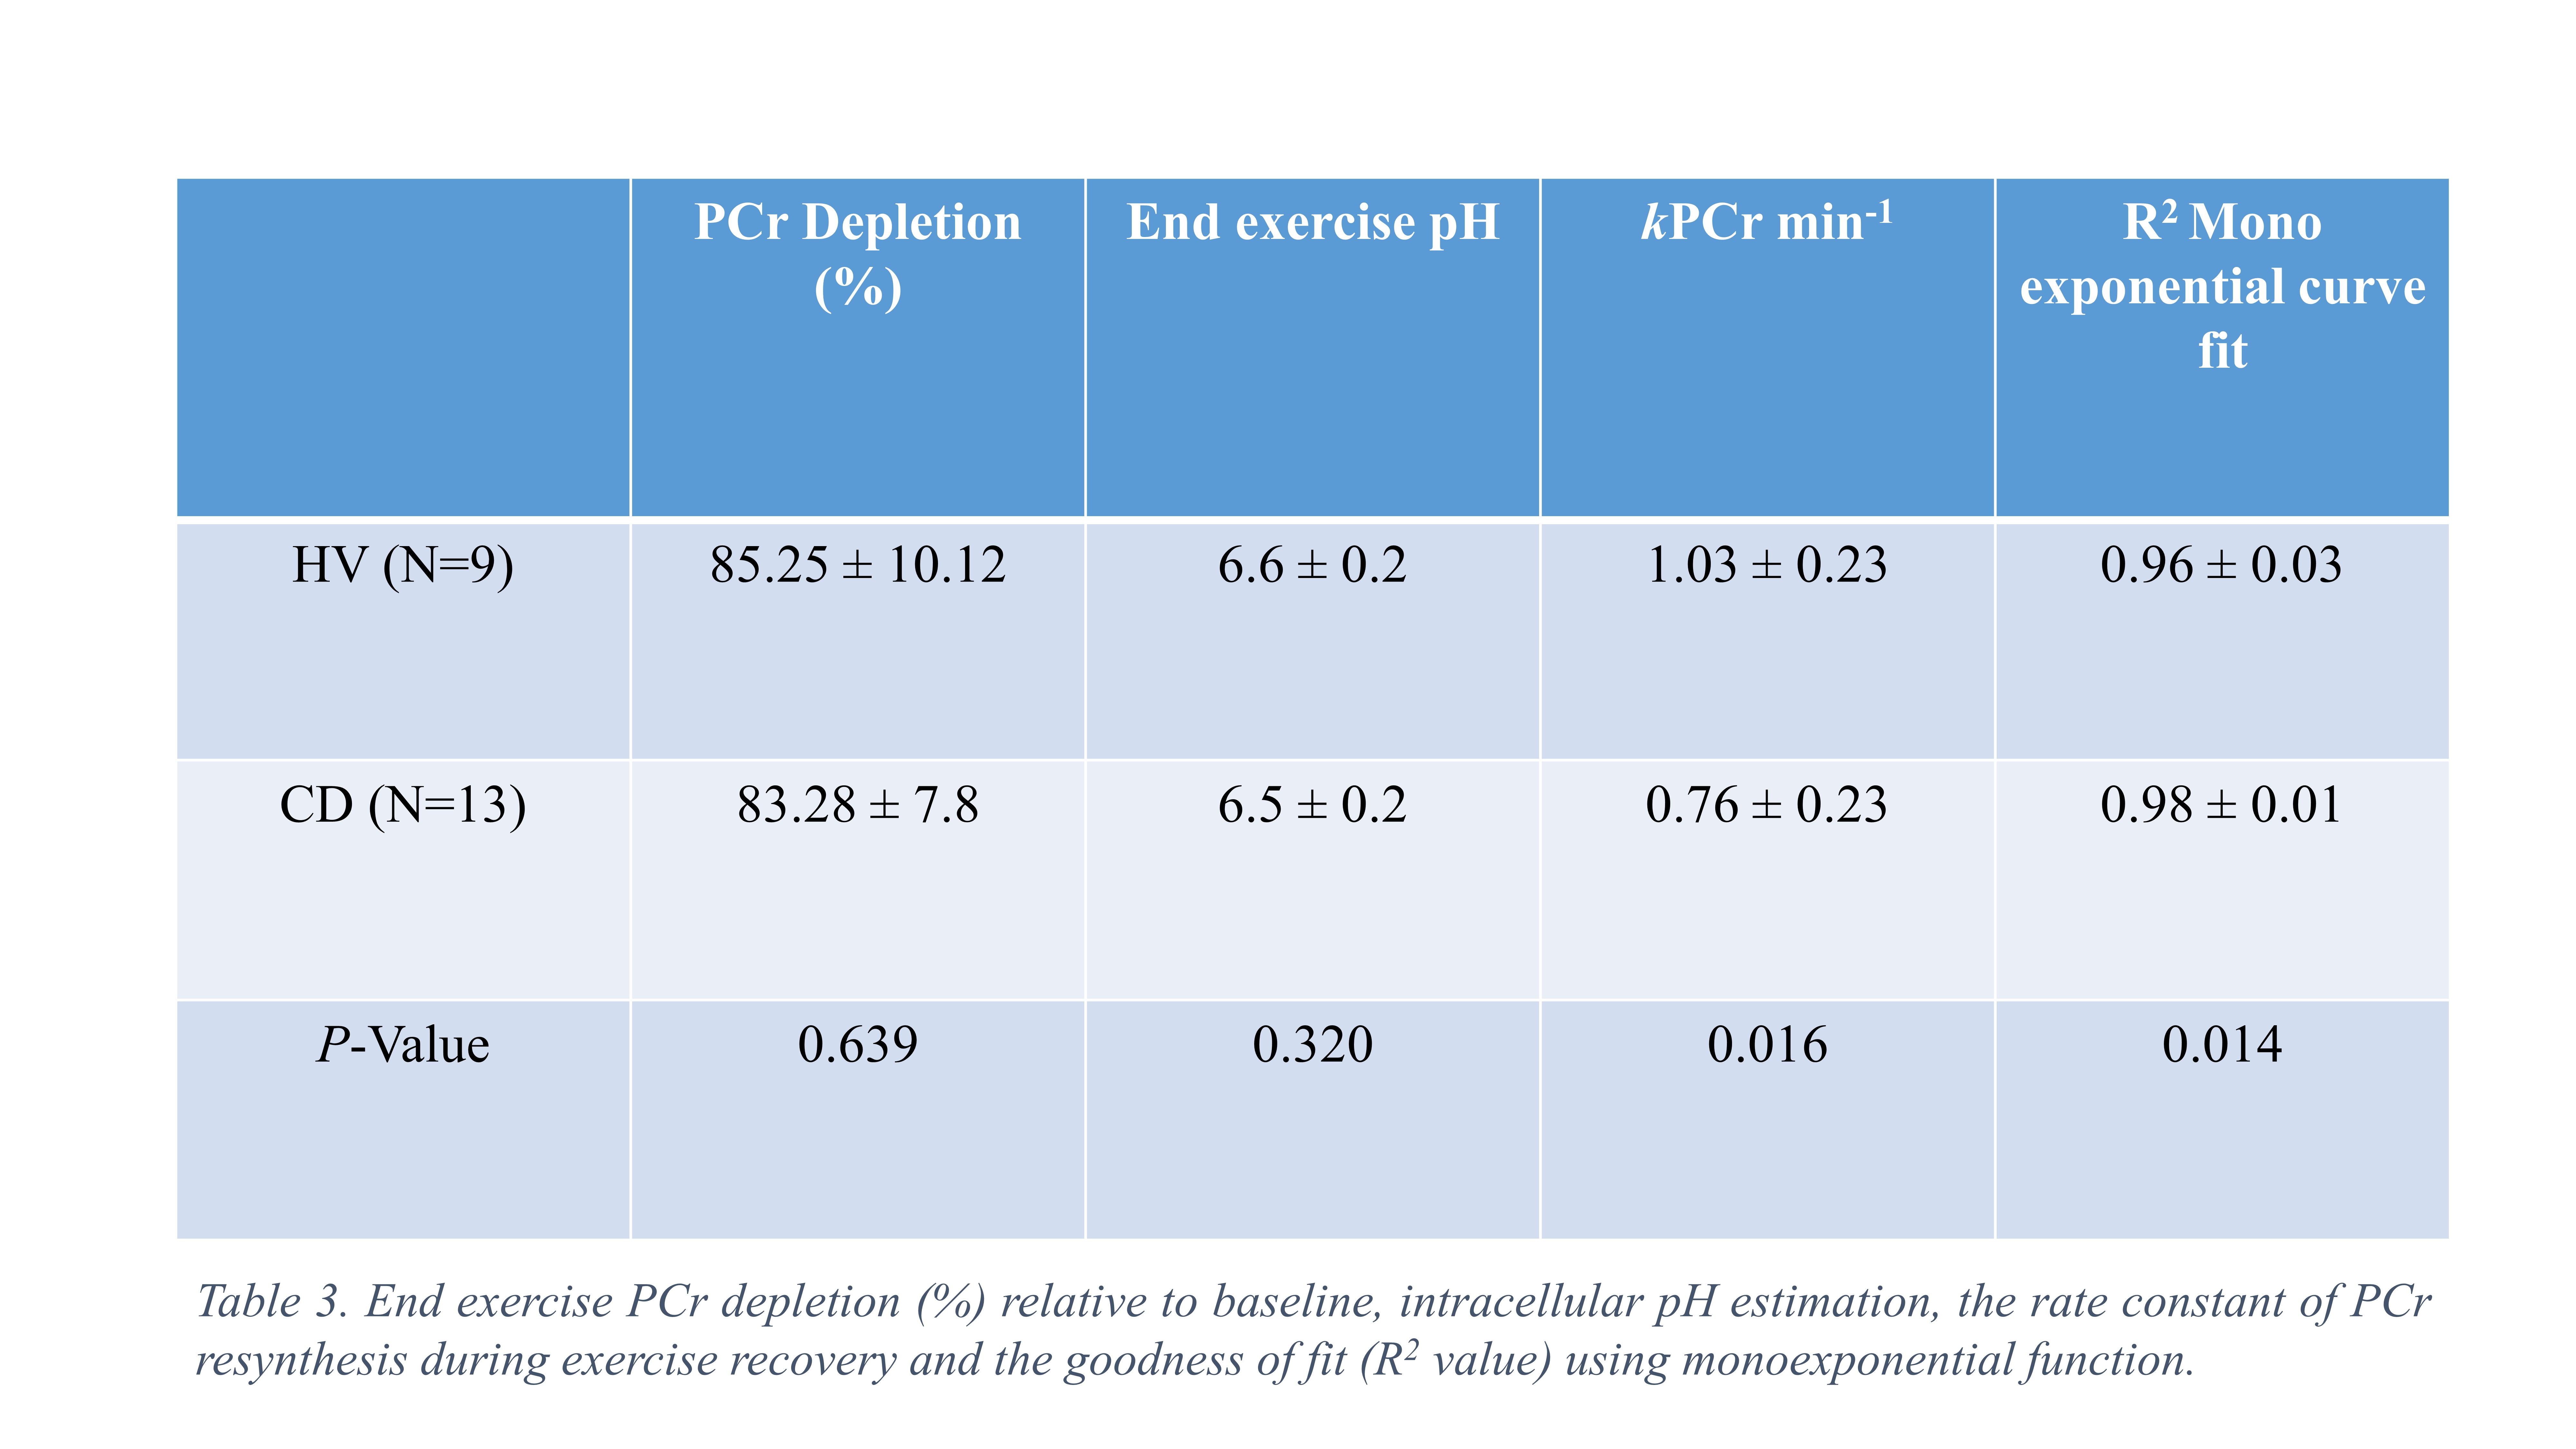
13 quiescent CD patients (7 female, HBI 1±2, CRP <5) and 9 HVs (4 female) were matched for age (P = 0.986) and BMI (P = 0.845). General fatigue score was greater in CD (13 ± 4) relative to HV (8 ± 3) (t19=3.08, P = 0.006) (Table 1.) End-exercise muscle PCr depletion (%) (85.25 ± 10.12 vs 83.28 ± 7.8%, P = 0.639) and estimated end-exercise muscle pH (6.6 ± 0.2 vs 6.5 ± 0.2, P = 0.320) was consistent between HV and CD. The mean rate constant of PCr resynthesis (kPCr min-1) in CD (0.76 ± 0.23) was significantly less (t20 = 2.6, P = 0.016) than HV (1.03 ± 0.23). PCr recovery curves were well described using a mono-exponential function in CD (R2=0.98 ± 0.01, R2value) and HV (R2=0.96 ± 0.03) (Table 3). 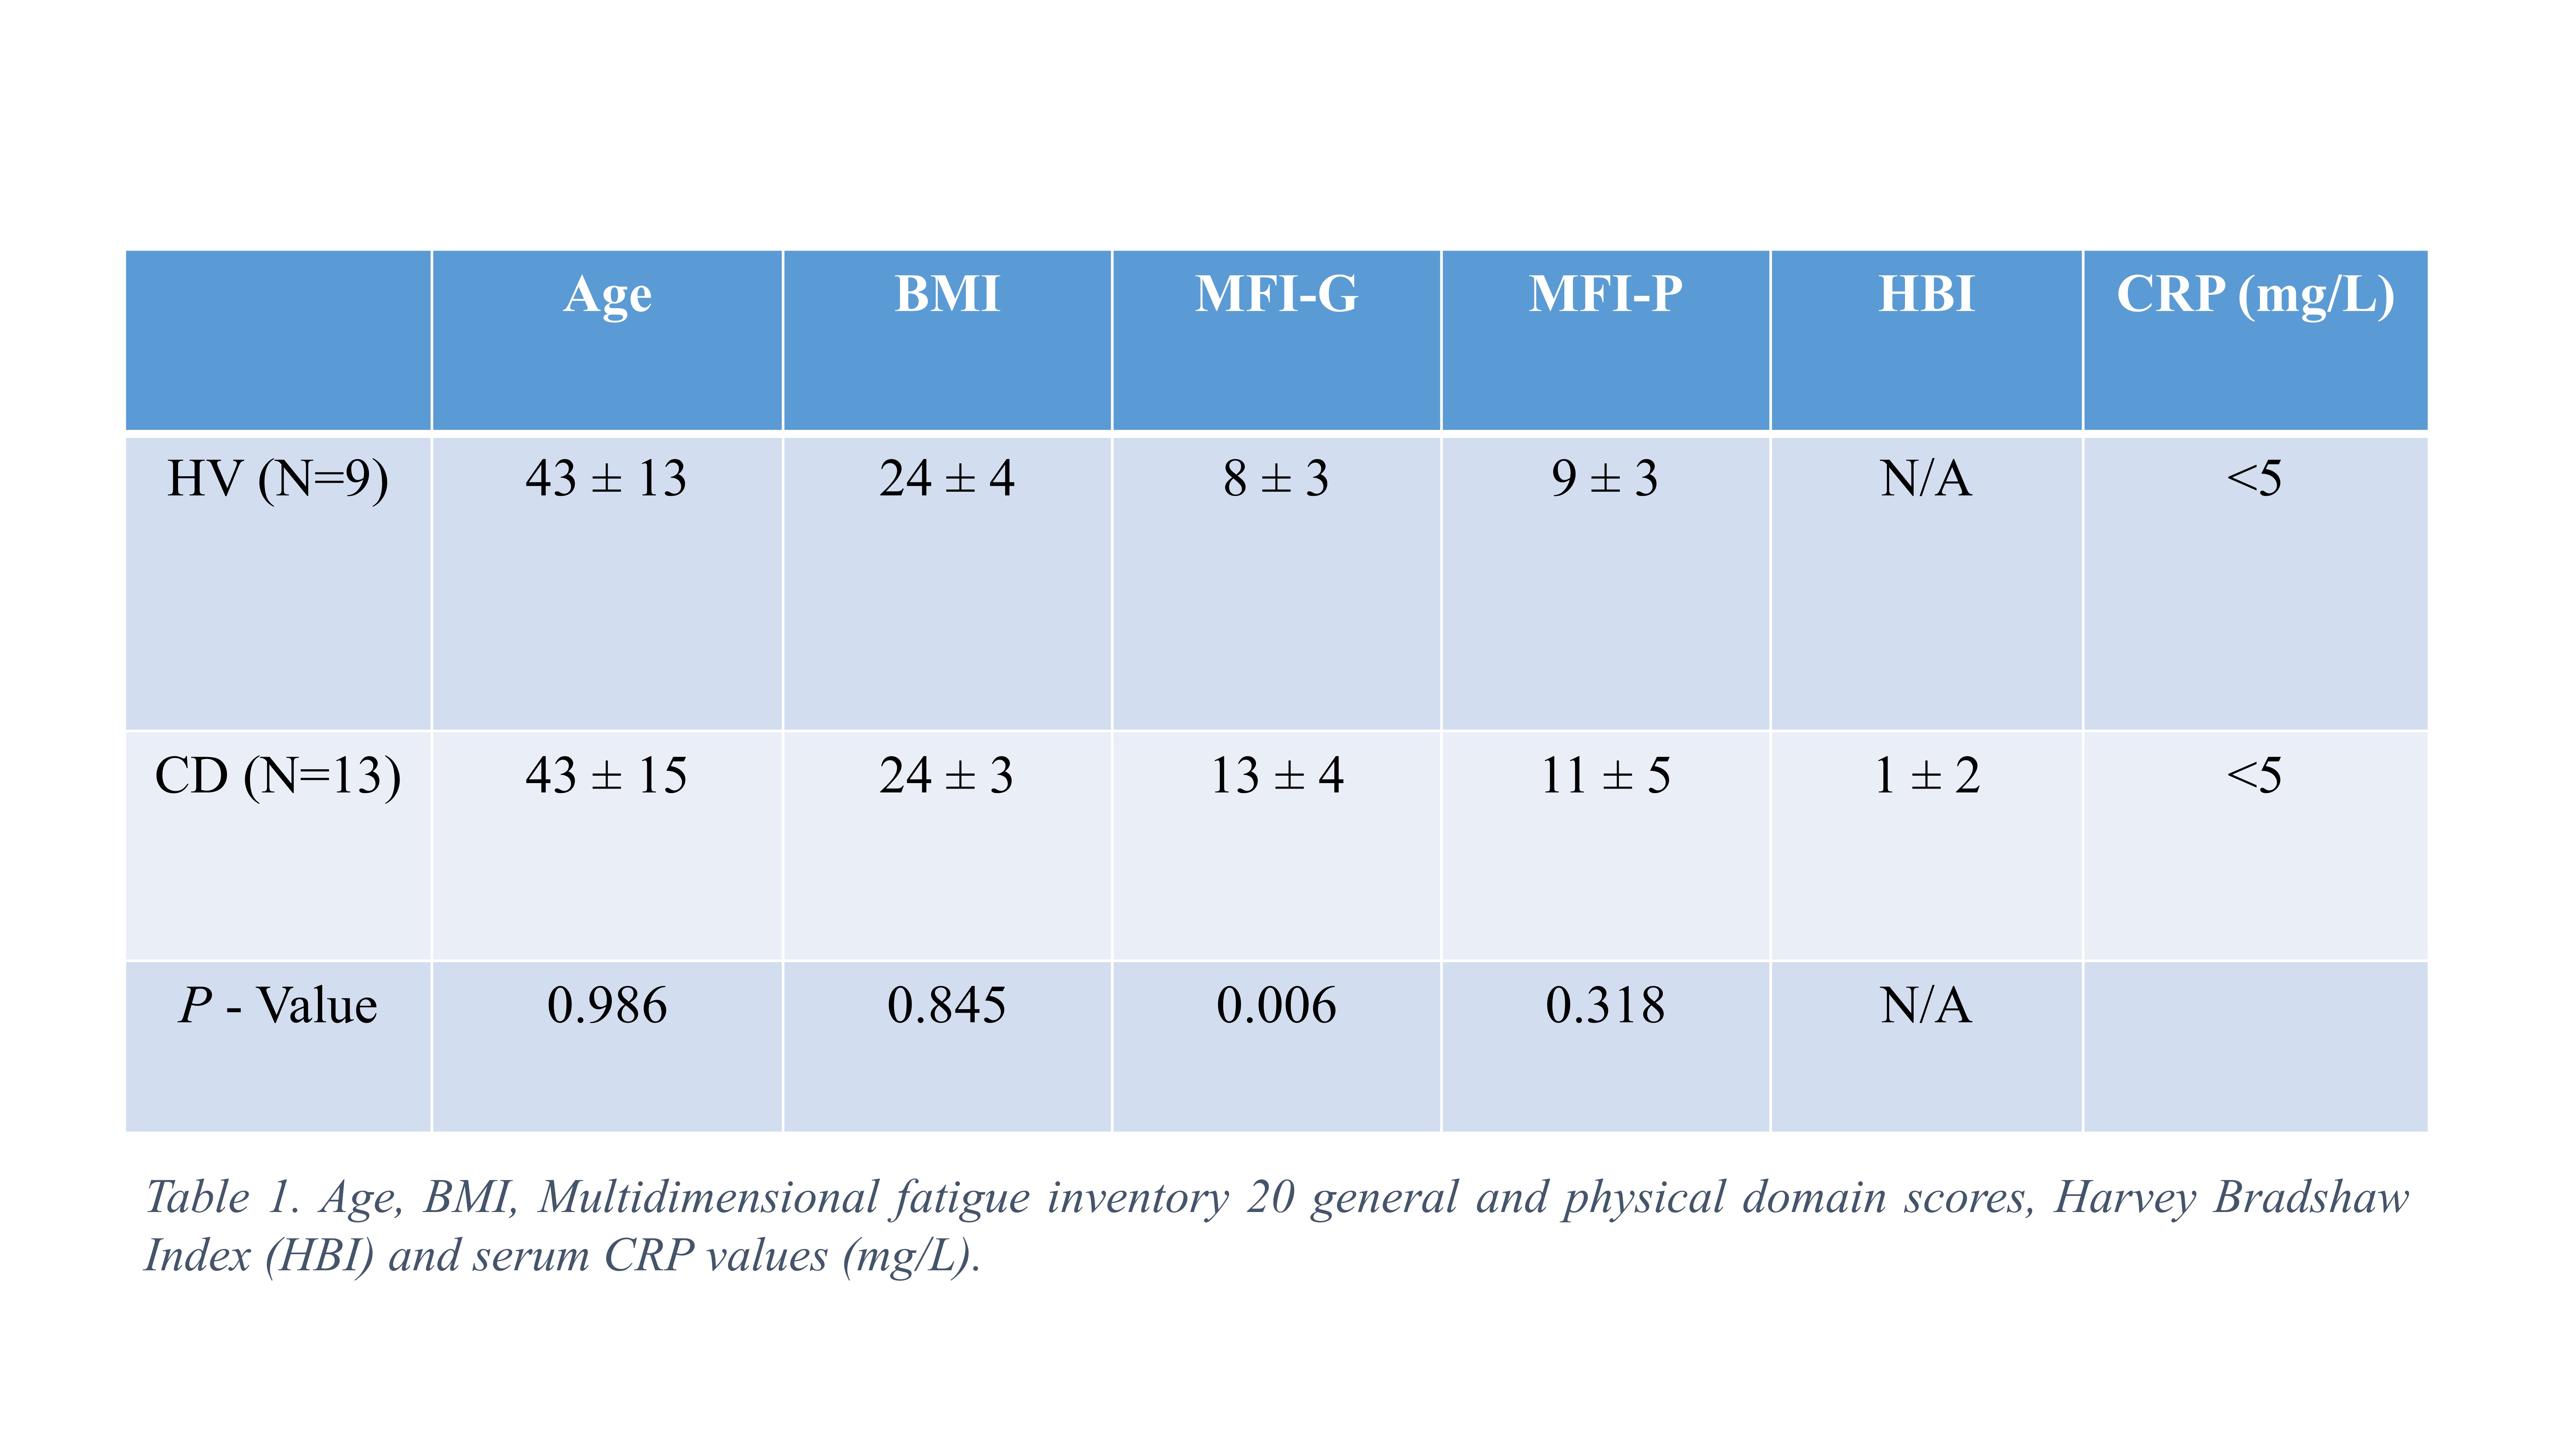


Conclusion
The PCr resynthesis rate following intensity matched ischemic exercise was less in fatigued CD patients relative to HV. This points to peripheral muscle deconditioning and associated loss of mitochondrial mass as a driver of exercise intolerance in IBD. This may be amenable to exercise training intervention.