
P158 Semi-automated detection of qualitative features of Crohn’s disease activity found on CT-enterography using machine learning
R. Stidham MD- MS1,2,3, B. Enchakalody3,4, A. Waljee1,2,5, G. Su3, M. Al-Hawary1,3,6, A. Wasnik3,6
1University of Michigan, Department of Medicine- Division of Gastroenterology and Hepatology, Ann Arbor, United States, 2University of Michigan, Michigan Integrated Center for Health Analytics and Medical Prediction MiCHAMP, Ann Arbor, United States, 3University of Michigan, Morphomic Analysis Program, Ann Arbor, United States, 4University of Michigan, Department of Surgery, Ann Arbor, United States, 5VA Ann Arbor Health Care System, VA Center for Clinical Management Research, Ann Arbor, United States, 6University of Michigan, Department of Radiology, Ann Arbor, United States
Background
Imaging is essential in the assessment of Crohn’s disease (CD) severity, phenotype, and therapeutic response. However, qualitative findings can be limited by interobserver variation and ambiguous feature definitions. Our aim was to evaluate computational approaches for identifying qualitative disease features using CT-enterography (CTE).
Methods
CD subjects with ileal CD and CTE imaging between 2009 and 2017 were retrospective identified at a single tertiary care centre. CTE scans were reviewed by two fellowship-trained abdominal radiologists who labelled diseased and normal bowel transitions agreeing on definitions of qualitative findings prior to labelling. Computed intestinal features were used by machine learning methods (k-nearest neighbour, support vector machines, random forest) to model regions of diseased bowel and predict qualitative findings with 5-fold cross validation. Cohen’s kappa with quadratic weighting was used to assess agreement between radiologists and model predictions.
Results
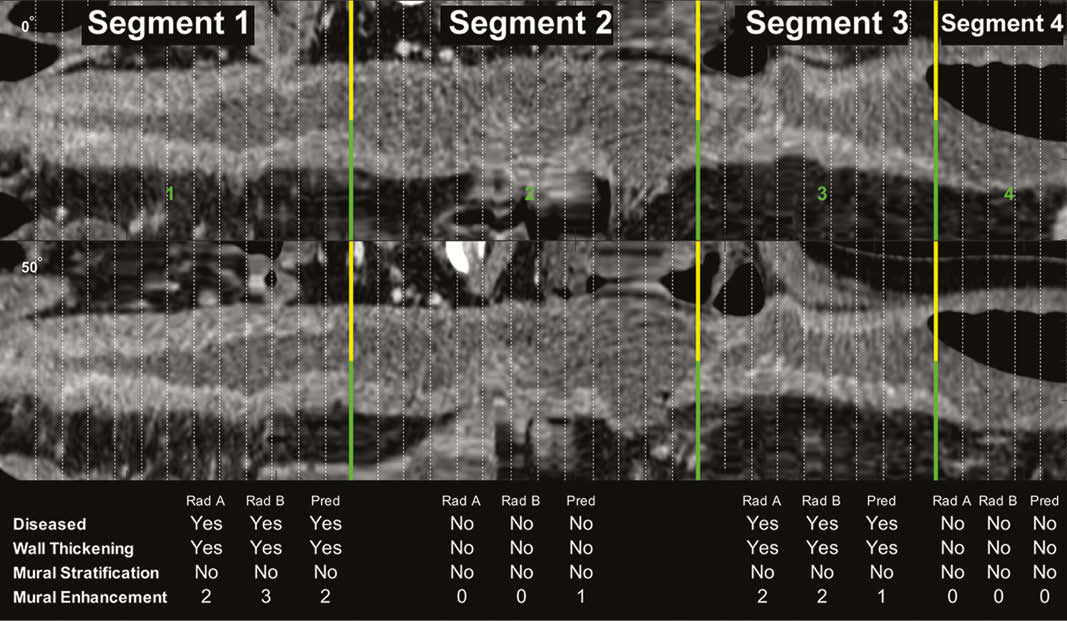
In 206 unique patients, 548 small bowel segments underwent paired radiologist review for qualitative imaging findings. Automated localisation of diseased vs. normal bowel segments had excellent performance, with an AUC, PPV, and NPV of 0.922, 0.924, and 0.918, respectively (Figure 1). Radiologist-to-Radiologist and Radiologist-to-automated prediction agreement on qualitative findings are shown in Table 1. Agreement on the degree of mural enhancement between radiologists was very good (
| Radiologist–radiologist | Automated prediction performance | ||||
| Kappa (95% CI) | Kappa (95% CI) | PPV | NPV | AUC | |
| Bowel Wall Thickening | 0.75 (0.69–0.81) | 0.77 (0.74–0.80) | 85.6% | 91.1% | 0.922 |
| Lumen Narrowing | 0.55 (0.49–0.61) | 0.65 (0.60–0.69) | 73.9% | 90.2% | 0.859 |
| Mural Stratification | 0.76 (0.71–0.81) | 0.51 (0.46–0.56) | 65.2% | 87.0% | 0.809 |
| Fat Stranding | 0.34 (0.27–0.41) | 0.26 (0.18–0.33) | 77.4% | 88.7% | 0.879 |
| Vascular Engorgement | 0.61 (0.51–0.71) | 0.14 (0.06–0.22) | 47.4% | 91.6% | 0.909 |
Conclusion
Computer vision methods have excellent performance for automatically distinguishing diseased from normal ileum and show potential for qualitative disease assessments of Crohn’s disease on CTEs.