
P233 Evaluating the association between faecal calprotectin and endoscopic outcomes in ulcerative colitis using the HICKORY open-label induction cohort
W. Reinisch1, B. El Azzouzi2, R. Li3, S. Lacey4, M. Daperno5, D. Mishkin6, K.T. Park7, A. Hassanali8, F. Hussain9, Y. Oh10
1Department of Internal Medicine III, Division of Gastroenterology and Hepatology, Medical University of Vienna, Vienna, Austria, 2Pharmacovigilance and Risk Management, Roche, Burgess Hill, UK, 3Product Development Biometrics, Roche, Mississauga, Canada, 4Department of Statistical Science, Roche, Welwyn Garden City, UK, 5Gastroenterology Unit, Mauriziano Hospital, Torino, Italy, 6Department of Gastroenterology, Atrius Health, Brookline, USA, 7Department of Gastroimmunology, Genentech, Inc., South San Francisco, USA, 8Department of Immunology, Genentech, Inc., South San Francisco, USA, 9Department of Medical Strategy and Science, IQVIA, Durham, USA, 10Department of Immunology, Infectious Diseases and Ophthalmology, Genentech, Inc., South San Francisco, USA
Background
In clinical practice, faecal calprotectin (FC) is used to monitor disease activity in ulcerative colitis (UC); however, there is no consensus on optimal cut-off values of FC for predicting endoscopic outcomes. FC performance has not been extensively assessed in the context of clinical trials using central endoscopy. This study aimed to evaluate the association between FC and endoscopic disease activity and to propose a meaningful cut-off FC value to predict endoscopic outcomes using data from the open-label induction (OLI) cohort of HICKORY (NCT02100696).
Methods
HICKORY is a Phase 3 study evaluating etrolizumab in anti-tumour necrosis factor α-experienced patients with moderate-to-severe UC. The study included patients who received ≥1 dose of etrolizumab 105 mg subcutaneously every 4 weeks during a 14-week induction period. Percentage change in FC was calculated at week 14. The endoscopic activity was measured by Mayo Clinic score (MCS) endoscopic subscore (ES) using a robust central-reading model. Endoscopic improvement was defined as ES=0/1; clinical remission as MCS ≤2 and no individual subscore >1. FC analysis was performed by Covance® (Bühlman FC ELISA assay). Receiver operator characteristic (ROC) curve analyses were used to calculate cut-off FC values.
Results
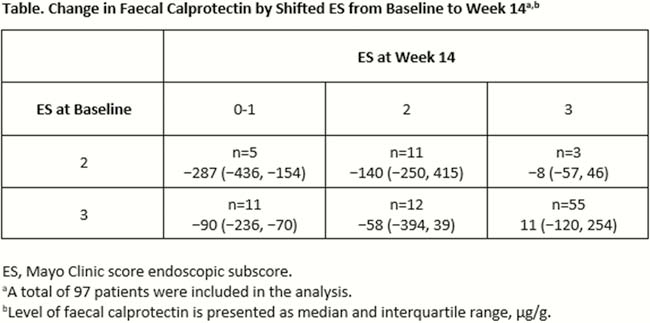
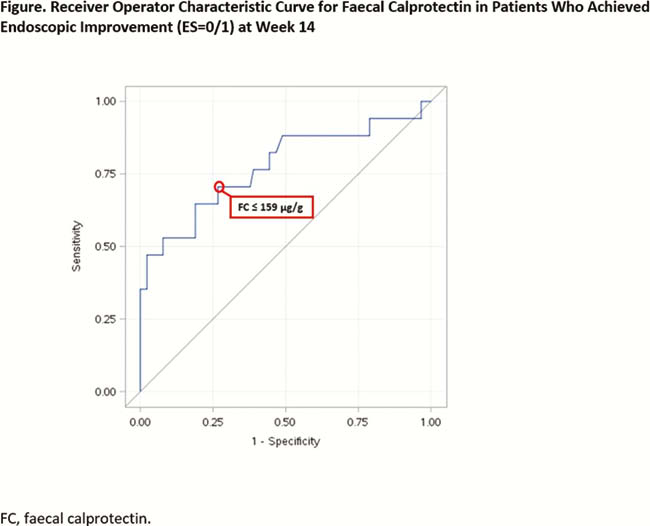
A total of 97 patients (mean age [standard deviation], 41.2 ± 13.4 years) were included in the analysis. Median (interquartile range [IQR]) baseline duration of disease was 6.3 (3.2–12.3) years with a median (IQR) MCS of 9 (8–10). Median (IQR) baseline FC and ES were 254 (156–455) µg/g and 3 (3-3). At week 14, median (IQR) FC percentage change was −13 (−57 to 112). A numerical association between changes in FC level and ES was observed (Table). A cut-off FC value of 159 µg/g was observed to predict endoscopic improvement with >70% sensitivity and specificity; ROC area under the curve was 0.78 (Figure). Similar results were observed for clinical remission.
Conclusion
In this exploratory analysis using HICKORY OLI cohort data, changes in FC appear to associate with changes in ES. A cut-off FC value of 159 µg/g predicted endoscopic improvement. In UC, FC may be a useful non-invasive biomarker for ascertaining endoscopic disease activity in clinical trials; however, further clinical studies validating FC cut-offs against centrally read endoscopy are needed.