
P411 Baseline Hypertrophy of the Submucosa at intestinal ultrasound predicts Failure of Treatment in patients with ulcerative colitis
de Voogd, F.(1);Duijvestein, M.(1);Ponsioen, C.(1);Löwenberg, M.(1);D'Haens, G.(1);Gecse, K.(1);
(1)Amsterdam UMC- Amsterdam Medical Center- University of Amsterdam, Department of Gastroenterology and Hepatology, Amsterdam, The Netherlands
Background
Submucosal fibrosis in ulcerative colitis (UC) has been associated with disease severity in colectomy specimens. As intestinal ultrasound (IUS) visualizes all individual wall layers, we aimed to evaluate baseline IUS features to determine endoscopic response and investigate changes in wall layers during anti-inflammatory treatment in patients with UC
Methods
Moderate-severe UC patients (endoscopic Mayo score (EMS)≥2) extending beyond the rectum starting treatment were included. Simple Clinical Colitis Activity Index (SCCAI), fecal calprotectin (FCP), IUS and endoscopy were performed at baseline and at follow-up between week 8 and 26. BWT, individual wall layer thickness (WT) (mucosa (MC), submucosa (SM) and muscularis propria (MP)) and ratios among layers, Colour Doppler Signal, loss of haustrations, loss of stratification and hyperechogenicity of the submucosa (HoS) (Figure 1) were scored for the sigmoid colon (SC). EMS was assessed for the SC: endoscopic remission (ER) was defined as EMS=0 and endoscopic improvement (EI) as EMS≤1. For statistical analysis a paired t-test and X2-test were used.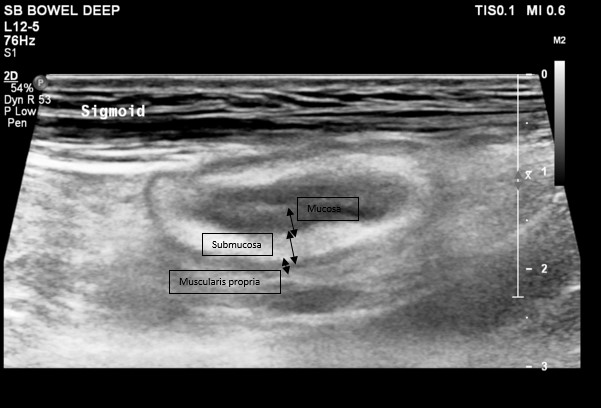
Figure 1: present hyperechogenicity of the submucosa
Results
49 patients were included of whom 61% failed ≥1 biological. 59% started tofacitinib and 41% started a biological. At follow-up, 30% and 49% reached ER and EI, respectively. BWT decreased significantly when ER (2.32 ± 1.63 mm vs 1.00 ± 1.98 mm, p=0.034) or EI (2.53 ± 1.66 mm vs 0.30 ± 1.58 mm, p<0.0001) was reached. In patients with ER and EI, the SM thickness showed significantly more pronounced decrease compared to the other wall layers (Table 1 and Figure 2). Baseline presence of HoS (29% of patients) predicted failure of treatment (ER: OR: 0.10, 95% CI: 0.01-0.87, p=0.014, EI: OR: 0.16, 95% CI: 0.04-0.65, p=0.008,). Furthermore, when HoS was present, SCCAI (7.33 ± 3.62 vs 9.75 ± 3.23, p=0.023) and FCP (1249 ± 903 µg/g vs 2494 ± 2277 µg/g, p=0.008) were significantly lower at baseline. Also, patients with HoS more frequently failed one (OR: 4.44, 95% CI: 1.08-18.32, p=0.03) or multiple biologicals (OR: 5.63, 95% CI: 1.54-20.52, p=0.009). However, disease duration (p=0.950) or age at onset (p=0.853) did not differ between groups. 
Figure 2
| ΔMC in mm | ΔSM in mm | ΔMP in mm | Δwall layer vs Δwall layer | |
| EI | -0.60 ± 0.84 | -1.28 ± 1.23 | -0.64 ± 0.59 | -MC vs SM: p=0.018 -SM vs MP: p=0.027 -MC vs MP: p=0.86 |
| ER | -0.37 ± 0.40 | -1.21 ± 1.36 | -0.58 ± 0.63 | -MC vs SM: p=0.05 -SM vs MP: p=0.11 -MC vs MP: p=0.36 |
Table 1
Conclusion
This is the first study showing that HoS on IUS is a predictor of endoscopic non-response to biologicals and tofacitinib in patients with UC. Additionally, changes in SM layer thickness is the most important component of the total bowel wall when evaluating mucosal healing on IUS.